


PostgreSQL has become super popular thanks to its flexibility and strength - it's this really powerful open-source database that can handle all sorts of tasks, from small projects to huge enterprise needs. But as data keeps getting bigger and bigger, it's super important to tweak things in PostgreSQL to make it run faster and smoother. Doing stuff like fine-tuning queries, setting up indexes smartly, and tweaking settings can make a huge difference. These tweaks aren't just about speed - they're about making PostgreSQL even more reliable and adaptable, keeping it at the top of the game in our data-heavy world.
Database performance enhancement is crucial for our business. Slow databases can affect all the aspects of our application, no matter in which domain we work. It’s crucial to include query plan optimization as a natural step during the development or maintenance. Apart from that, we should also focus on other aspects of PostgreSQL query tuning like indexing strategies or join optimizations. In this article, we’re going to understand how to address various aspects of PostgreSQL performance optimizations to make sure our applications never slow down.
Understanding PostgreSQL Performance Optimization
Enhancing PostgreSQL performance involves following this workflow:
Gather metrics and metadata to establish a baseline.
Investigate the underlying causes of each performance issue.
If the existing data is insufficient to pinpoint the root cause, gather additional information.
Examine the collected baseline data for any anomalies.
Performance problems usually happen for the following reasons:
IO Inefficiency: This occurs when the query reads numerous rows or when a small number of rows contain substantial data, typically in the form of JSON, images, or XML.
CPU Inefficiency: The query consumes a significant amount of CPU resources.
Insufficient Memory: In cases where multiple queries contend for limited cache space, the server continually reads data from the hard drive to cache and flushes the cache back to the hard drive.
Concurrency Issues: Many concurrent queries attempt to access a resource (read or write), leading to blocking situations where SQL commands wait for others to complete.
Slow Network: While the database server swiftly executes the query, the time taken to send the result set back to the application server is prolonged due to a slow network.
Suboptimal Configuration: Poorly configured settings contribute to the suboptimal performance of the query engine.
Suboptimal execution plans: When essential statistics are absent, the Query Planner suggests suboptimal plans, resulting in the generation of inefficient queries.
The Query Planner
SQL is declarative. The SQL command states what data to retrieve: which tables, which column, how to filter the data… However, the SQL command doesn’t state how exactly to run the query.
Let’s look at this example:
SELECT
    orders.order_id,
    orders.order_date,
    orders.order_amount,
    customers.customer_id,
    customers.customer_name
FROM
    orders
JOIN
customers ON orders.customer_id = customers.customer_id
WHERE
    orders.order_date > ‘2022-01-01’
    AND orders.order_amount > 1000
ORDER BY
orders.order_date DESC;
Just by looking at the SQL, we don’t know anything about the actual execution of the query:
Which indexes exist on the relevant tables?
Which indexes are the most efficient? How many rows are read to return the data?
How exactly are the tables joined together?
Are there any implicit conversions?
How sorting the data affects the order of retrieving the data and joining it?
The PostgreSQL Query Planner optimizes SQL queries through a cost-based approach, considering factors such as available indexes, table statistics, and join strategies. It determines parallel execution, may rewrite queries, and adapts based on actual performance feedback.
Key responsibilities include:
Cost-Based Optimization: Evaluate execution plan costs.
Statistics: Use up-to-date table and index statistics.
Available Indexes: Consider index usage for efficient data retrieval.
Join Strategies: Choose optimal join methods for multiple tables.
Parallel Execution: Determine when to execute queries in parallel.
Query Rewriting: Transform queries for improved efficiency.
Feedback Mechanism: Adapt based on feedback about actual performance.
User Hints: Allow advanced users to provide optimization hints.
Indexing Strategies for PostgreSQL
Creating indexes for a database can be a complex task. Here are some guidelines to simplify the process.
Start with educated guesses
Initially, feel free to adopt a simple or best-effort approach and rely on informed speculation. Once you have concrete data on usage patterns and identify queries causing bottlenecks in your database, leverage this information to determine which indices to establish and which to remove. Keep in mind that indices come with a cost, so choose judiciously based on the observed usage patterns.
Detect the slow queries and their access method
The best strategy is a blend of rigorous performance tests to prevent inefficient queries from being deployed to production. There are tools that can make this task pretty straightforward. Additionally, actively monitor slow queries in the production environment to adapt and fine-tune index choices based on real-world usage. This iterative approach ensures optimal performance without sacrificing production stability.
It's important to know how each query is accessing data (Execution Plan). It might already be using an index, and if there's a performance problem, it could be due to other factors. Sometimes, even if an index exists, the system might decide not to use it. Understanding these aspects helps solve performance issues more effectively.
Recommended reading: Reading Postgres Execution Plans Made Easy
Verify the index is used
Even if there's an index, the query planner might choose not to use it, for example, when the WHERE clause involves a function.
-- Good
WHERE start_date BETWEEN ‘2024-01-01’ AND ‘2024-12’31

-- Bad. There is a function on the start_date column
WHERE YEAR(start_date) = 2024
Multi-column indexes
When you have a complicated condition in your WHERE clause, it's helpful to build an index on multiple columns instead of having many separate ones. This way, the database can efficiently handle queries with intricate conditions, improving performance by using a single index structure instead of multiple ones.
Covering Indexes
We use the term "covering index" when an index can satisfy an entire query on its own, without needing to refer back to the original table or another index for additional data. Prioritize creating covering indexes for your most resource-demanding queries, weighing the benefits against the additional space required for dedicated indices. This works when the query needs only 3-5 columns, as creating an index with 6+ columns is rare.
Advanced Indexes and Data Storage
Databases have evolved beyond a simple table with a B-tree index. New types of indexes, each with a specific purpose, have been introduced, making them a practical choice for optimizing certain types of queries.
Column Store Index for Analytics: A column store index organizes data by columns rather than rows, making it efficient for analytical queries that involve aggregations and reporting. It's optimized for scenarios where a large number of rows are scanned and grouped.
Hyper Tables for Time Series: Hyper tables are specifically designed for efficient storage and retrieval of time series data. They provide features like automatic partitioning and retention policies, time functions, and filling gaps, making them well-suited for applications dealing with time-based data, such as IoT sensors, log files, or financial time series.
BRIN (Block Range Index) Index: BRIN indexes are suitable for large tables where data is sorted in chronological or numerical order. They divide the table into blocks and store the minimum and maximum values for each block, minimizing the storage overhead. BRIN indexes are useful for scenarios where data exhibits a natural ordering, such as time-series data.
GIN (Generalized INdex) Index for JSON: GIN indexes are designed for efficient querying of JSON data. They allow for indexing individual elements within JSON documents, enabling fast searches and retrievals. GIN indexes are valuable when dealing with complex and nested JSON structures commonly found in modern applications.
Bloom Filter Index: A Bloom filter is a probabilistic data structure used to test whether an element is a member of a set. It's particularly useful when the goal is to quickly eliminate non-members without the need for a full database lookup. Bloom filters are memory-efficient and find applications in scenarios like caching, spell-checking, and distributed systems.
Plan optimization tip: Regularly analyze and tweak execution plans, focusing on indexing strategies and query structuring to reduce execution time and resource usage. Utilize EXPLAIN and EXPLAIN ANALYZE commands to deeply understand query execution paths and identify performance bottlenecks.
Optimizing Query Plans in PostgreSQL
An execution plan in a database outlines the steps the database engine will take to retrieve data for a specific query. For example, which indexes to use, how exactly to join the data, and when to sort the results.
There are many differences between Actual and Estimated Execution Plans:
Estimated Execution Plan:
Is created by the query planner BEFORE the query is executed.
The query is not executed. It is calculated based on statistics and assumptions, providing a prediction of how the database will process the query.
Since the query is not executed, the plan is generated in a few milliseconds.
Actual Execution Plan:
Is generated after query execution, reflecting the real steps taken by the database engine.
Provides accurate information about resource usage such as the number of rows scanned and execution times of each step.
How to optimize a plan:
Before generating execution plans, it's essential to prepare data and queries that closely resemble the conditions of the real-world production database. Simulating a realistic environment ensures that the execution plans obtained accurately reflect the challenges and nuances present in actual usage. Without this preparation, the generated plans may not provide meaningful insights into the performance characteristics of the queries in a production setting. Once it’s done, you can perform the following steps:
Generate the Actual Execution Plan: Obtain the execution plan for the query using the EXPLAIN ANALYZE command.
Review the Execution Plan: Examine the execution plan to understand the sequence of operations, access methods, and join strategies employed by the database engine. Since the plan can be a very long JSON text, use tools, such as Metis to identify the slowest steps.
Identify Table Scans and Index Usage: usually, this is the first place to look for slow steps. Look for instances of full table scans or missing index usage. These can be performance bottlenecks, and optimizing them can significantly improve query speed.
Evaluate Filter Conditions: Examine filter conditions and WHERE clauses to ensure they are selective. Indexes should be utilized to narrow down the dataset early in the query execution.
Check Join Operations: Analyze join operations to ensure efficient join methods are being employed. Consider the use of appropriate indexes to enhance join performance. Verify the join columns have the exact data types and no data conversions are needed.
Limit the Number of Returned Rows: Evaluate whether the query needs to return the entire result set or if limiting the number of rows can improve performance. Consider using the LIMIT or FETCH FIRST clauses, especially when dealing with large datasets.
Update Statistics:
Ensure that statistics on tables and indexes are up-to-date. The last update date is not saved inside the execution plan. For PostgreSQL, you can use a query like this:
SELECT schemaname, relname, last_autoanalyze, last_analyze FROM pg_stat_all_tables WHERE relname = 'table_name';
Monitor and Iterate:
Execute the optimized query in a real-world scenario and monitor its performance. Iterate the optimization process based on actual execution results and continue refining the query as needed. By systematically analyzing the execution plan and addressing identified issues, you can fine-tune the query for optimal performance in your specific database environment. Regular monitoring and iteration ensure ongoing optimization as data distributions and usage patterns evolve.
Advanced Performance Tuning Techniques
Now let’s delve into more advanced performance-tuning techniques.
Table Partitioning
Partitioning is a database design technique focusing on dividing large tables into smaller ones called partitions. The partitions are created based on multiple criteria like ranges of values or hashing algorithms. See our guide to efficient partitioning to see how this technique works.
By partitioning tables, queries can access only a subset of data which results in faster query execution times. The database engine doesn’t need to read all the data but can read the appropriate partitions only. This way we bring fewer rows and effectively execute queries faster.
Partitioning is especially useful for large databases which we can logically split into smaller ones based on business criteria, like dates, customer identifiers, tenant identifiers, or geographic locations. However, this requires the particular queries to work only within a subset of the partitions. If the query needs to read all the data, then partitioning won’t be helpful.
Concurrency Control
Concurrency control in databases is about managing simultaneous access to the same data by multiple users or transactions while ensuring consistency and correctness. Since we want to achieve the maximum possible performance, we want multiple transactions to run at the same time and not wait for each other. However, several transactions might attempt to access or modify data concurrently, which can lead to various issues like lost updates, inconsistent reads, or conflicts. See our article about transaction isolation levels to learn more.
We can achieve higher performance in many ways. We can let some transactions proceed without waiting for the latest data by using lower isolation levels (like Read Committed or Read Uncommitted). We can configure transactions to work with snapshots by using Multi-Version Concurrency Control (MVCC). We can also modify particular statements within transactions to use different isolation levels. All these techniques can improve performance by unblocking transactions from waiting.
We need to understand that these techniques should be evaluated based on business requirements. While it’s attractive to claim that our application always works with the “latest data” and never shows outdated records, this is effectively impossible in distributed systems. The distance between New York and Sydney is 53 light-milliseconds. We can’t exchange information faster than light can travel. This effectively means that any information exchange between New York and Sydney to achieve consensus takes at least 212 milliseconds (two full round trips). Internet signals take longer to process (we typically assume around two-thirds of the speed of light) so we should expect at least 318 milliseconds. If we want to achieve global consistency, we need to limit ourselves to at most 3 transactions per second in theory (effectively it’s even worse).
Taking the limits of physics into account, we need to evaluate how our business can deal with propagation delays. Maybe we don’t need to lock the records in order to process them, maybe we can run compensating transactions, or maybe we should accept the cost of making wrong decisions very infrequently.
Advanced Configuration Tweaks
We can tune various database parameters to increase the performance.
The first aspect is shared memory. This comes down to shared_buffers, work_mem, and max_connections. These parameters control the amount of memory used for caching data, sorting, hashing, or for simultaneous connections. If we have a high amount of memory, we can increase these parameters to improve performance. See our article about PostgreSQL parameters to learn more.
The second aspect is about disk I/O. This comes down to selecting proper drives (like high-performance NVMe drives or SSDs) or using proper RAID setups. We can also tune parameters to adjust the Write-Ahead Logging settings or the frequency of storing the data on the disk. These parameters are wal_level, effective_io_concurrency, or checkpoint_timeout. We can tune them to achieve the highest possible throughput.
Last but not least, we can configure background maintenance tasks. One of them is vacuuming which we can configure with autovacuum_vacuum_scale_factor and autovacuum_max_workers. We can also trigger vacuuming manually. Another aspect is bloated indexes. We can rebuild them with the REINDEX command and we can restructure tables using an index with the CLUSTER command.
Finally, we can also scale the database vertically and horizontally. Vertical scaling is when we replace the hardware with a more powerful one. Horizontal scaling is when we add more hardware to build a cluster of nodes that can share the load.
Leveraging Monitoring Tools For Performance Insights
Query optimization is hard. However, many steps can be automated and we can get good support from optimization tools. Monitoring tools provide real-time insights into the performance of your database. They allow you to identify and address performance bottlenecks, slow queries, and resource-intensive operations. By analyzing the data collected by monitoring tools, you can fine-tune your database configuration, indexes, and queries to improve overall performance. Let’s see some examples.
Metis
Metis can analyze queries and provide insights about each execution:
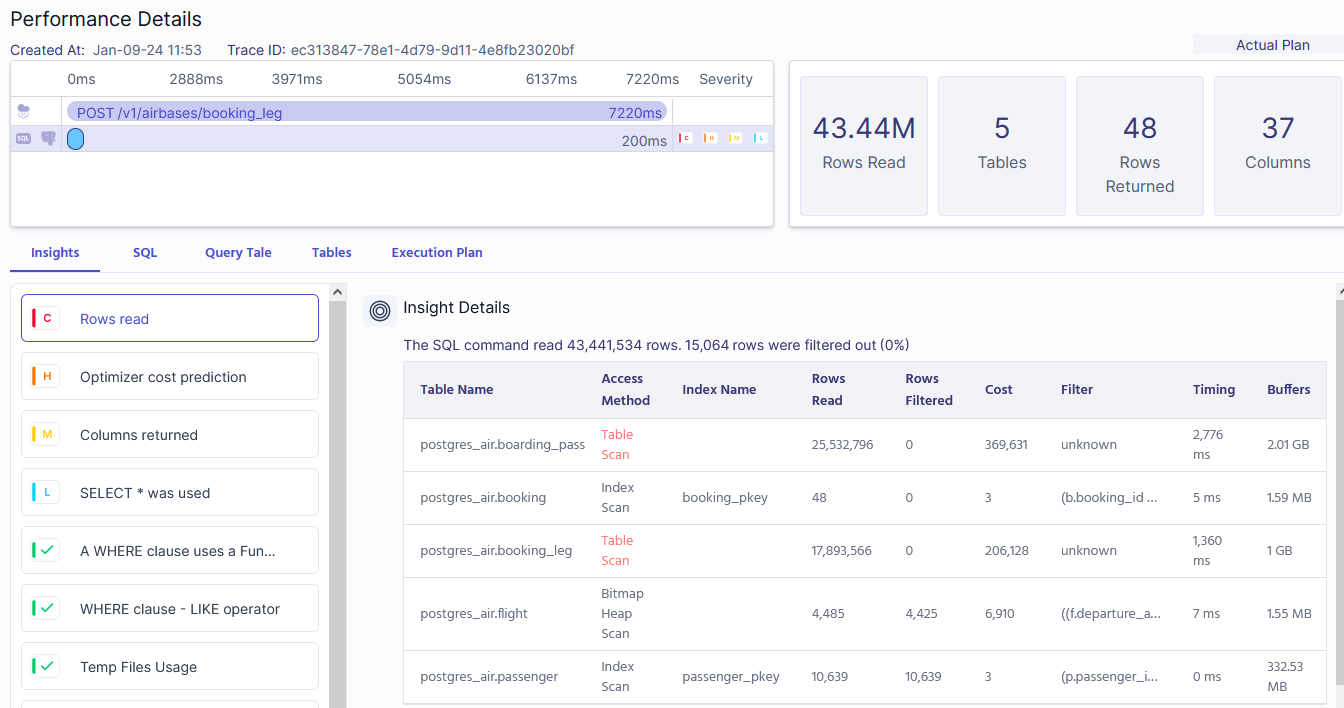
With Metis, you don’t need to manually capture plans and look for common issues. Metis does that for you. It integrates with your application and your database, extracts the activity, and provides an explanation of what happened. You can use it to learn facts about the interaction, immediately get alerts about obvious issues (like lack of index), and get actionable ideas on how to rewrite the query to get it faster.
Metis can also visualize the plans for you, analyze schema migrations, monitor the live performance, and integrate with your CI/CD pipeline to analyze pull requests.
pgMustard
Another tool is pgMustard.It can visualize queries and suggest improvements:
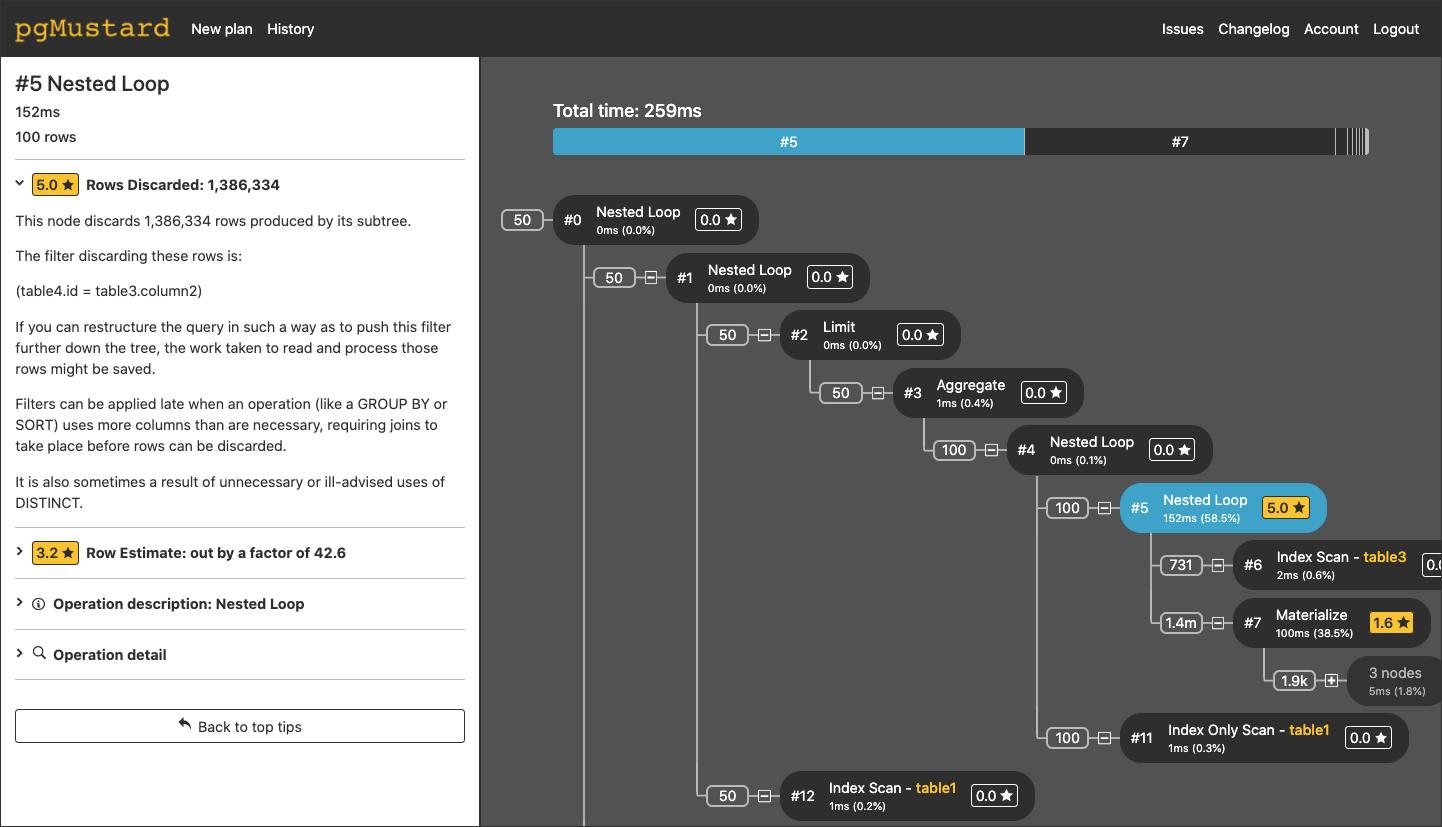
Reading query plans is hard. pgMustard can make it much easier by providing graphical explanations of each operation. While it doesn’t tell you immediately how to fix the query, it can be a good starting point for understanding why the query is slow.
PostgreSQL Workload Analyzer
PostgreSQL Workload Analyzer (PoWA) can gather data from various extensions that can explain how queries work.
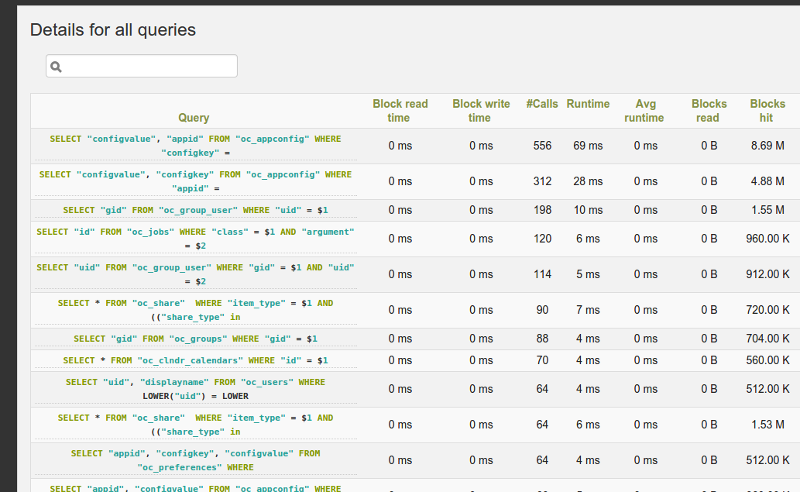
PoWA can integrate with your database and correlate data from multiple sources. This gives a great understanding of what was happening around the time when the slow query was executed. Sometimes the problem with the query is not in the query itself but with things happening around it. PoWA can shed some light on the whole context.
Conclusion
SQL performance is crucial for our business. Slow databases affect our whole tech stack and in turn whole ecosystems. There are many techniques to tune the performance: it all starts with the query plan that explains what happened. We can tune data access patterns to use indexes or read less data. We can improve filtering and joins, denormalize the database, partition tables, play with concurrency, or do many more things specific to each particular database engine.
There are many tools that can help with database performance. Some of them focus on bringing data from multiple sources, and some of them specialize in one particular aspect of the process. Metis is the only tool that takes a holistic approach and optimizes everything, from the very first code change to the production database.
FAQs
How can I optimize a slow query in PostgreSQL?
You can use various optimization techniques, including indexes, query restructuring, join optimizations, query plan analysis, scaling (both vertical and horizontal), sharding the data, denormalizing tables, or using specialized extensions.
What are the best practices for index tuning in PostgreSQL?
You need to pick the right indexes for your data types, include the columns that cover the whole query, modify filters to utilize indexes, and use specialized solutions for your business domain like JSON indexes or vector databases.
How do I configure PostgreSQL for high performance?
You start by tweaking shared memory and I/O parameters to reduce the number of reads from the drive. You then tune the number of connections and level of parallelism that your database supports. Next, you adjust the background tasks and make sure that statistics and fragmentation are under control. Finally, you focus on queries one by one to understand why they are slow.
What tools are available for monitoring PostgreSQL performance?
Metis is the only tool that takes a holistic approach to database tuning. It starts with analyzing developers’ environments to find slow queries and inefficient schema migrations. It integrates with CI/CD to stop dangerous changes from being deployed. Finally, it monitors the live performance of the production database to identify anomalies and configuration differences. There are other tools that help with monitoring like pgMustard that can visualize the queries and suggest improvements, or PoWA that can capture details from multiple extensions and present them together to build a bigger picture.
What is the difference between vertical and horizontal scaling in PostgreSQL?
Vertical scaling is when we replace the hardware with a more powerful one. Horizontal scaling is when we add more hardware to build a cluster of nodes that can share the load.